No state selected
View By
Percentage
- 100%
- 90%
- 80%
- 70%
- 60%
- 50%
- 40%
- 30%
- 20%
- 10%
- N/A
Scale Score
- 300+
- 280-300
- 260-280
- 240-260
- 220-240
- 200-220
- 0-200
- N/A
Scale Score
- 200+
- 180-200
- 160-180
- 140-160
- 120-140
- 100-120
- 0-100
- N/A
Percentage
- 10%
- 9%
- 8%
- 7%
- 6%
- 5%
- 4%
- 3%
- 2%
- 1%
- N/A
Percentage
- 20%
- 18%
- 16%
- 14%
- 12%
- 10%
- 8%
- 6%
- 4%
- 2%
- N/A
Percentage
- 100%
- 98%
- 96%
- 94%
- 92%
- 90%
- 88%
- 86%
- 84%
- 82%
- N/A
Drop Out Rate
- 100%
- 90%
- 80%
- 70%
- 60%
- 50%
- 40%
- 30%
- 20%
- 10%
- N/A
Dollar Per Pupil
- $20,000+
- $15,000-$20,000
- $10,000-$15,000
- $0-$10,000
- N/A
Response
- $100,000+
- $75,000-$100,000
- $50,000-$75,000
- $25,000-$50,000
- $0-$25,000
- N/A
Wage Index
- 1.5+
- 1.25-1.5
- 1-1.25
- 0-1
- N/A
Grade Drop Rate
- 8+
- 6-8
- 4-6
- 2.5-4
- 1.5-2.5
- 1.25-1.5
- 1-1.25
- 0-1
- N/A
Counselor to Student Ratio
- 0.0075+
- 0.005-0.0075
- 0.0025-0.005
- 0-0.0025
- N/A
Score
- 35-40
- 30-35
- 25-30
- 20-25
- 16-20
- 0-16
- N/A
Response
- Yes
- No
- N/A
Response
- Yes
- No
- Other
- N/A
Response
- Same
- Similar
- Other
- N/A
Response
- Proficient
- Basic
- Other
- N/A
Response
- 7 thru 12
- 6 thru 12
- 5 thru 12
- none listed
- N/A
Response
- 40-50
- 30-40
- 20-30
- 10-20
- 1-10
- N/A
Response
- Advanced
- Proficient
- Basic
Response
- A
- A+
- A-
- B
- B+
- B-
- C
- C+
- C-
- D
- N/A
Click on a state in the map above to view all STEM Indicators
The Need for Successful STEM Education
Career opportunities in STEM fields continue to grow, and experts anticipate more jobs becoming available because of retirements and new technologies. Skills learned through STEM education also continue to influence jobs across the global economy. Problem-solving, computational thinking and collaboration – all learned in STEM education – are in high demand across career fields.
STEM skills also contribute to individual and community well-being. From building a dollhouse to developing household budgets and effectively contributing to public life, we each put STEM skills to work every day.
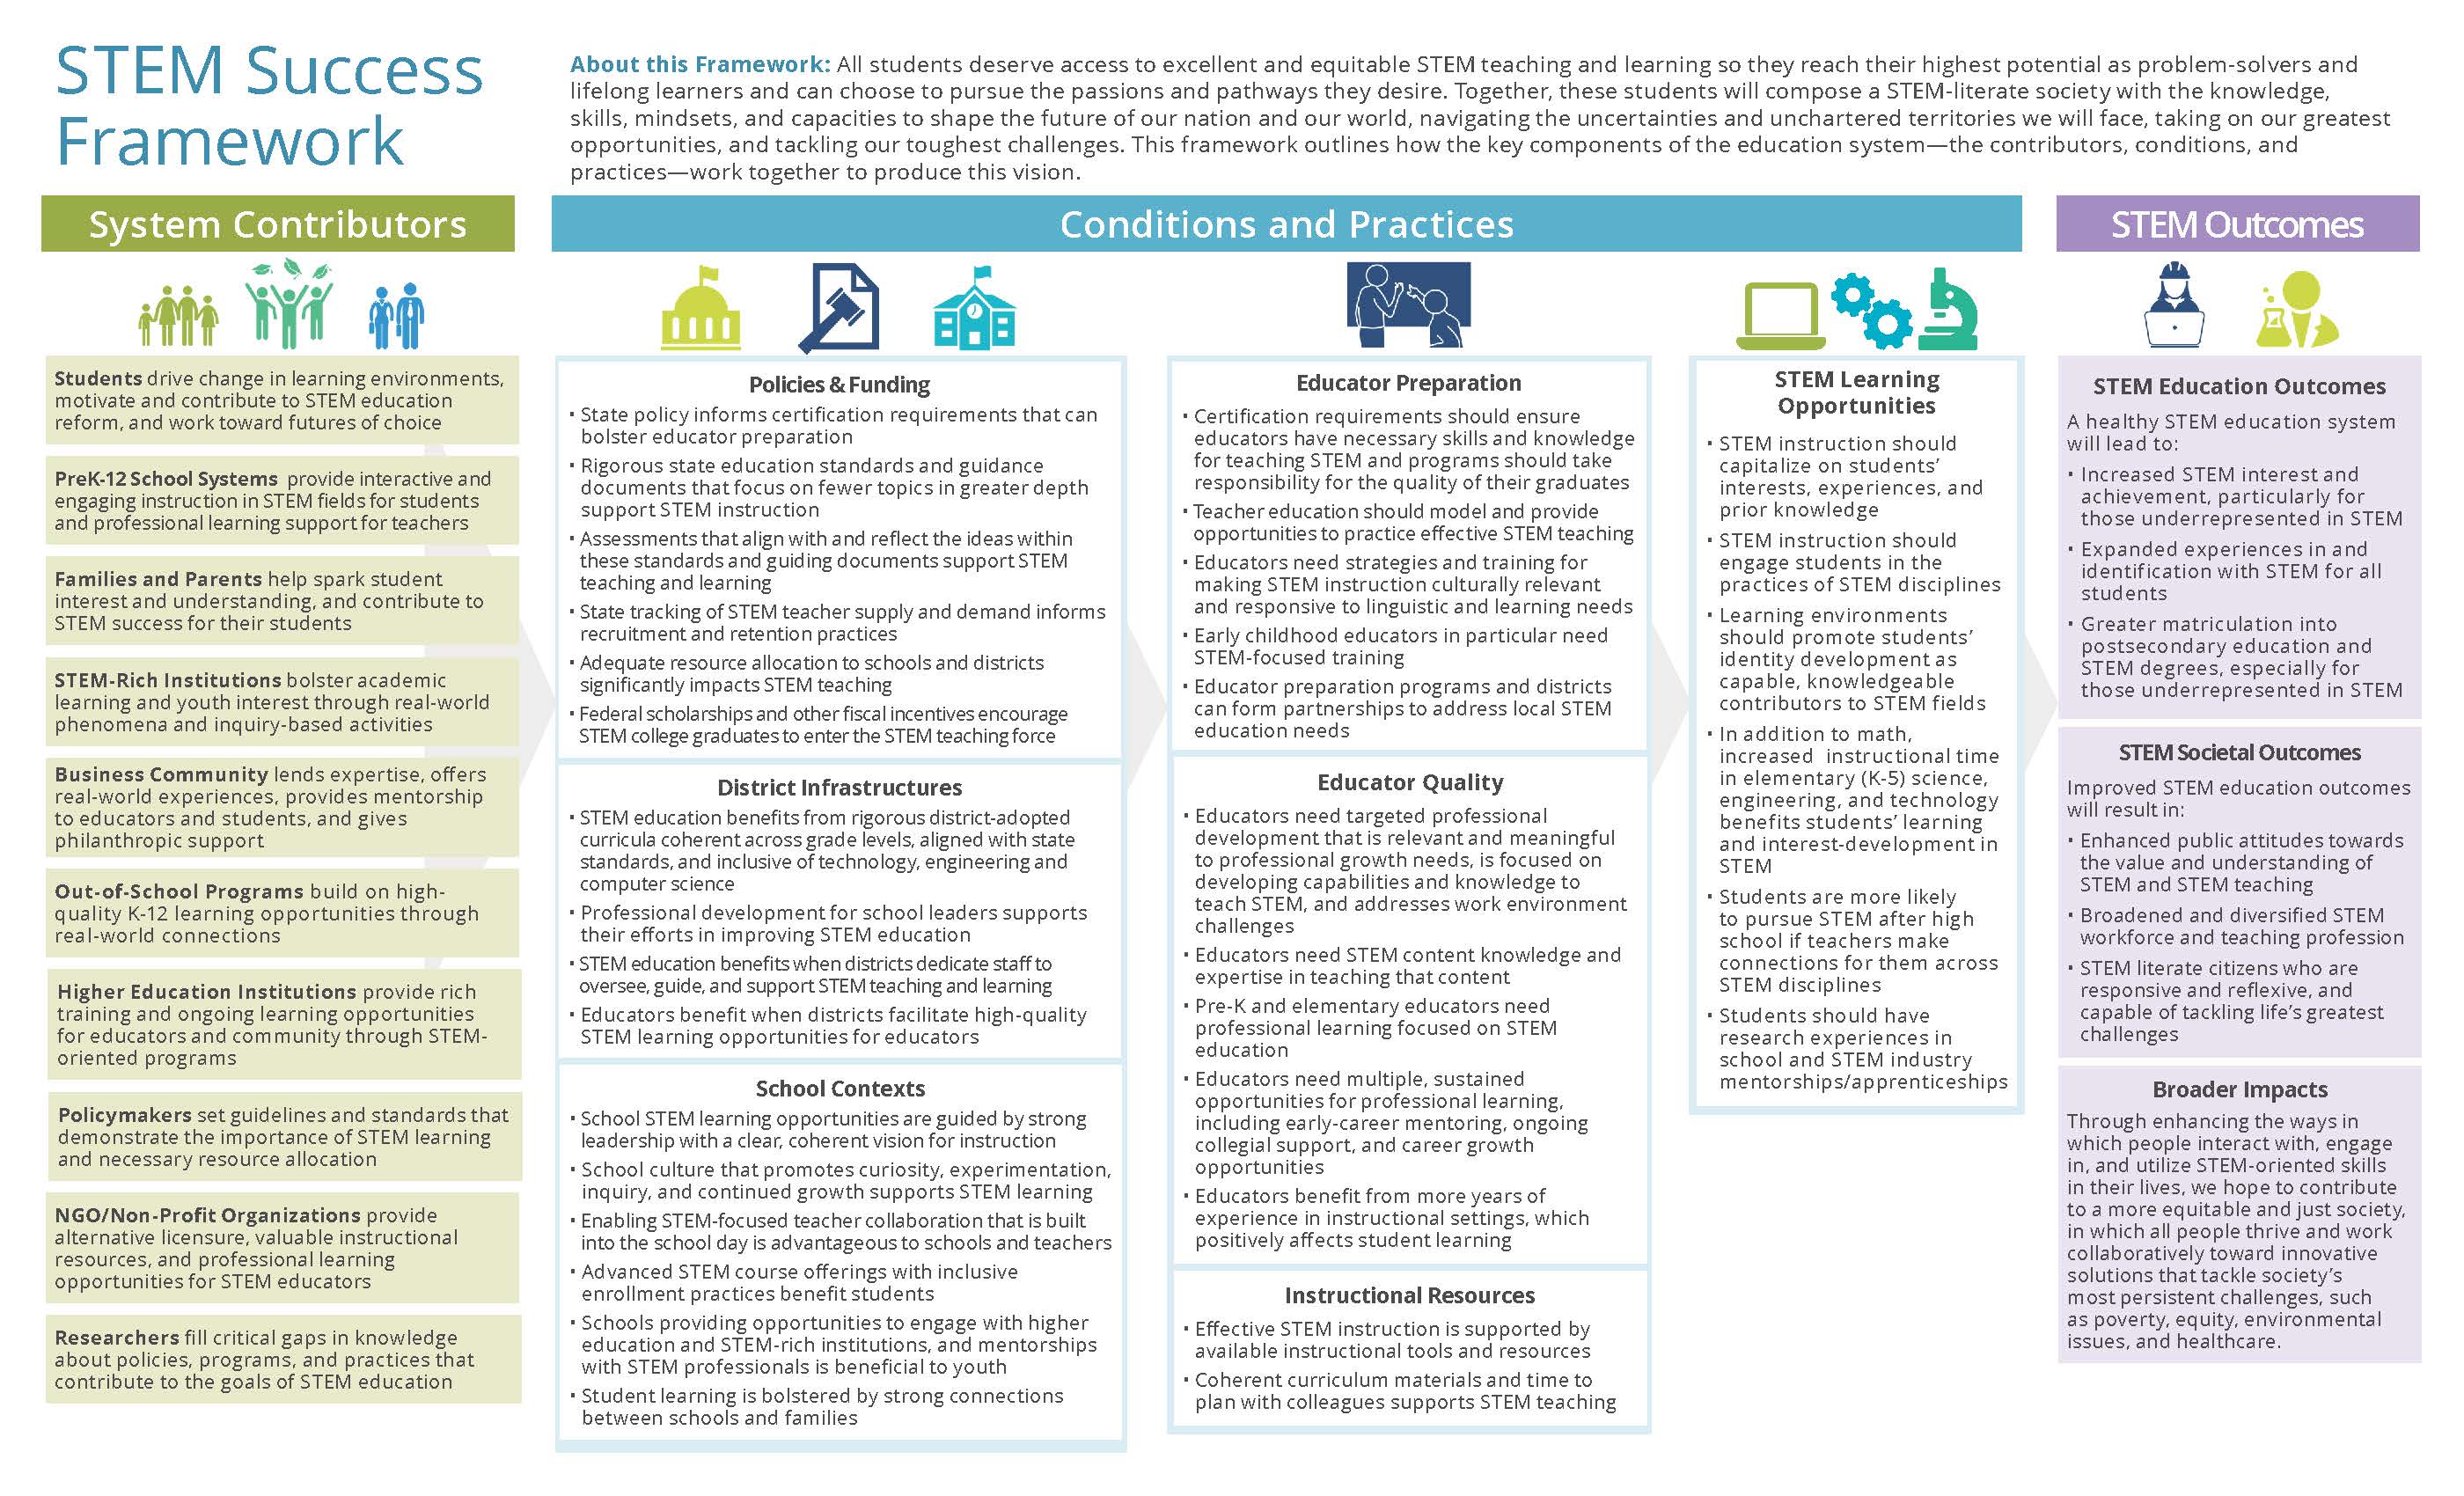
STEM Framework for Success
The STEM Framework for Success is a collection of 10 conditions, practices and outcomes that education and research experts agree help indicate how well a state, school system or school is performing in the delivery of STEM education. Each element of the Framework is measured by publicly available data, and visually reported through the STEM Opportunity Index.
About This Work
In 2017, the National Math and Science Initiative publicly committed to eradicating STEM Deserts. To meet that commitment, the Dallas-based nonprofit worked with 100Kin10 and SRI International to organize a working group of education and research experts. Through 2018, more than 50 organizations* contributed to the work that resulted in the STEM Framework for Success, the backbone of data on which the STEM Opportunity Index is built.
Additional contributors include Barings, which provided visualization support, the American Institute for Research, which collected and organized more than 100 datasets, Genentech Inc, which provided support and expertise in the development of the Framework, and Mapbox, the data mapping resource.
* Additional contributors will be added as more features of the STEM Opportunity Index are unveiled.
With Support Provided By
Join Us
The National Math and Science Initiative has committed to work with partners to maintain the STEM Framework for Success and to consider changes based on research-based feedback.
Policymakers, school system leaders and researchers are encouraged to contact NMSI for more information about the Framework.
Parents and community members also are encouraged to contact NMSI and representatives of education service organization can reach out for potential partnership.


